Are you saving enough for retirement?
Whether it's due to overspending on housing, the cost of living, or splurging too much on non-essentials, many Americans are falling short of their retirement goals.
According to a report by Fidelity, 52% of U.S. households may not be able to cover essential expenses once they retire.
Where you live - and how you live - before your retirement can have a tremendous impact on your finances and savings. But which cities provide the best opportunities to build a financial nest egg for retirement?
We took a closer look at where Americans have the best opportunities to build a nest egg by analyzing key factors related to personal finances and budgeting, including housing affordability, income and income growth, cost of living, economic stability, and tax friendliness. Our ranking analyzed these key metrics throughout the 170 most populous cities across the country to determine where the best cities to save for retirement are located.
Key findings
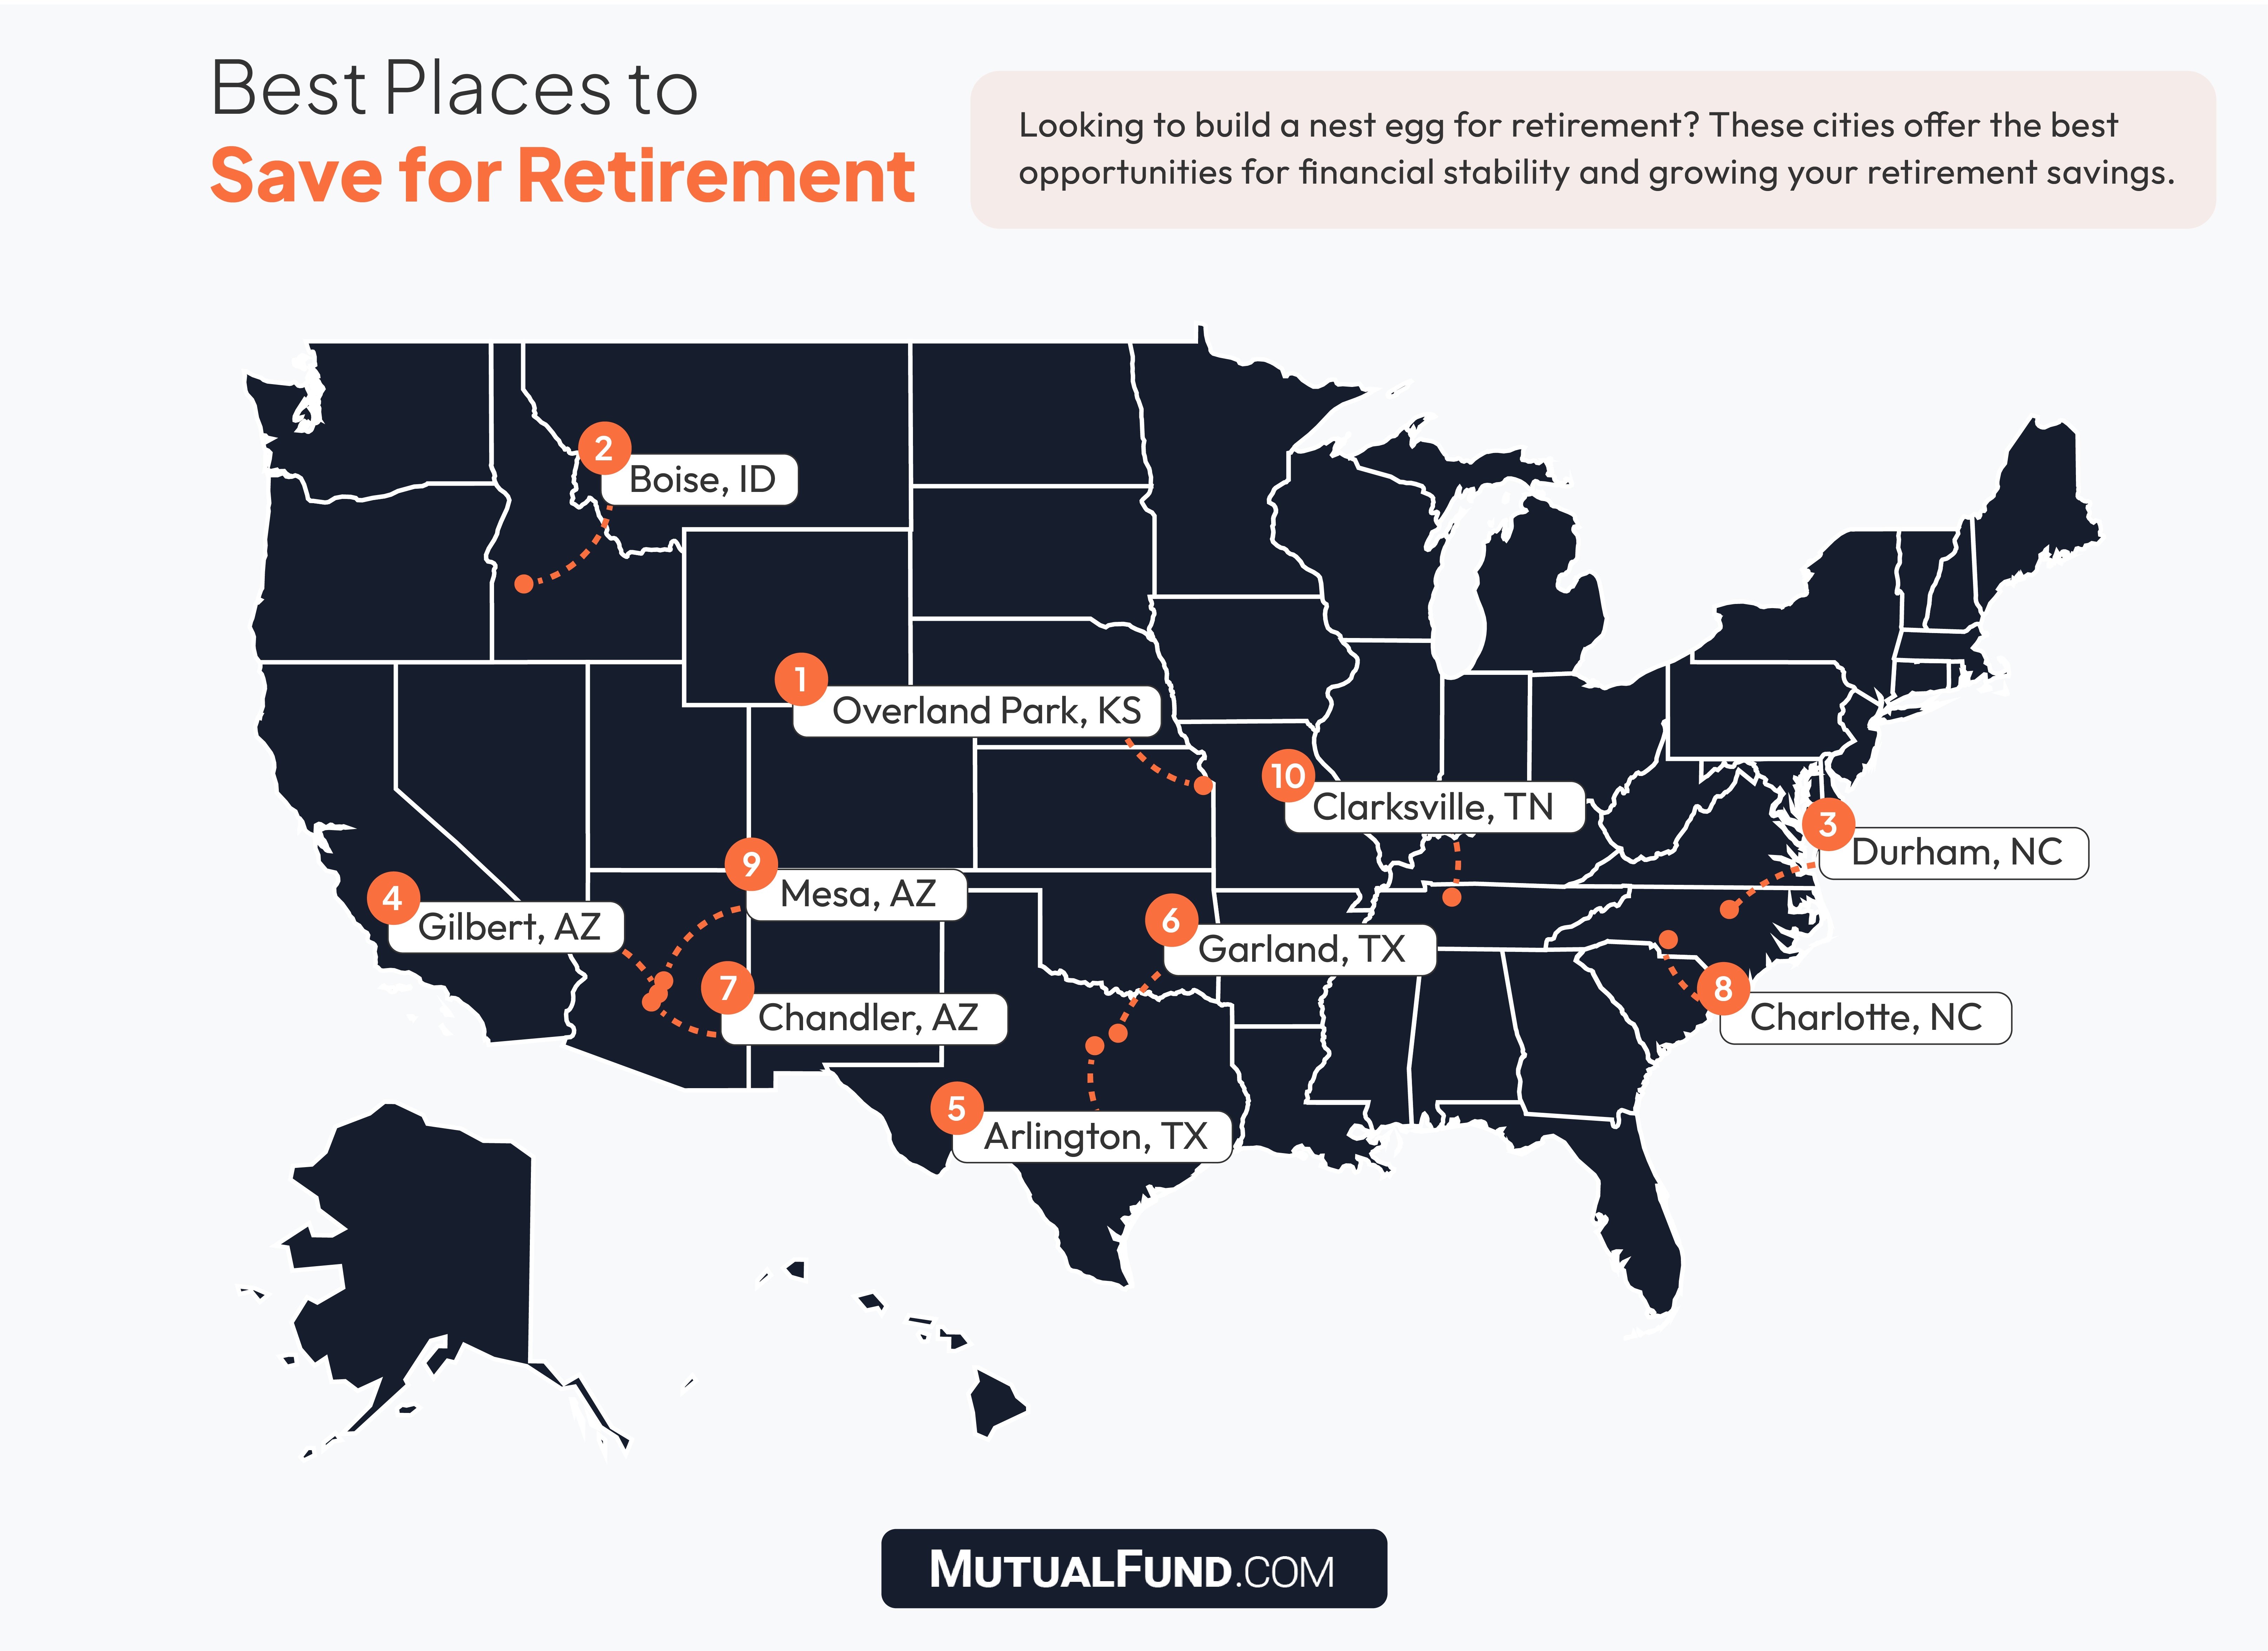
- Cities within the Dallas and Phoenix metropolitan area are prominently featured within the top 10 best cities to build a nest egg for retirement, including Gilbert, Arizona (No. 4), Arlington, Texas (No. 5), Garland, Texas (No. 6), Chandler, Arizona (No. 7), and Mesa, Arizona (No. 9).
- Every city within the top 5 has a poverty rate below the national average (12.6%), according to the Census Bureau.
- Among the top 10 cities, the average monthly housing costs are $1,771, which is below the nationwide average ($1,775).
- Perhaps unsurprisingly, the worst cities to live in to save for retirement are also among the most expensive, especially in terms of housing, including Los Angeles, California (No. 1), Anaheim, California (No. 2), and New York City, New York (No. 3).
How much do you need for retirement?
It’s a question that runs through the minds of millions of Americans. A good rule of thumb is to plan on spending roughly 80% of your pre-retirement income in order to sustain your lifestyle after you retire. However, other experts suggest saving 10 times your income before retiring.
The bottom line is that there is no one-size-fits all approach to retirement savings. What works for some may not work well for your goals, risk tolerance, and time horizon.
But living within your means and budgeting properly can put you in an ideal position to save the most amount of money as possible for retirement. In order to identify the best places in America to build a nest egg, we considered several financial factors, including housing costs, which can make or break your budget and prevent you from saving more for retirement.
From Overland Park, Kansas, which boasts low poverty and unemployment rates as well as high median household income, to Arlington, Texas, which has no state income tax, each city on our list presents unique advantages for retirement savers.
Where are the best places to save for retirement?
Top 5 best cities to save for retirement
#1. Overland Park, Kansas
Part of the Kansas City metropolitan area, Overland Park tops our list due to the city’s low poverty rate (5%), low unemployment rate (just 2.5%), and high median household income ($96,694). Additionally, the median home price in Overland Park comes in at $413,250, resulting in an income-to-housing cost ratio of 4.27, which is below the recommended rule of no more than 5 times your household income. According to the U.S. Bureau of Economic Analysis, Overland Park’s cost of living index hovers below the national average, making essentials less expensive compared to the rest of the nation and leaving plenty of money to stash away for retirement.
#2. Boise, Idaho
Boise, Idaho's largest city by more than 100,000 residents, stands out as a top destination for those aiming to build their nest egg through increased earnings. Bolstered by robust tech and healthcare sectors, Boise boasts a relatively high median household income of $81,425. However, what truly distinguishes Boise is its remarkable year-over-year income growth rate of 15.96%, significantly surpassing the national average of 7.23%. Despite its economic growth, monthly housing costs in Boise remain just below the national average, with a median monthly housing cost of $1,700 compared to $1,775 nationally. This leaves ample room to allocate funds for the golden years.
#3. Durham, North Carolina
As part of the Research Triangle, Durham attracts scientists, techies, and academics of all stripes, so it follows that the city’s median household income of $78,105 outpaces the national average of $74,755. These higher incomes carry more weight in Durham, where the median monthly housing cost is just $1,555, over $200 below the national average. With a low unemployment rate of 2.8% and an impressive income growth rate of 9.48%, Durham emerges as an ideal destination for long-term settlement and nest egg accumulation.
#4. Gilbert, Arizona
While Gilbert's clock tower may playfully suggest that newcomers are running behind schedule, stepping into Gilbert these days means you're arriving right on time. Gilbert boasts a robust median household income of $111,393 per year, approximately 1.48 times the national average. Moreover, the city maintains a low poverty rate of 4.8%, a stark contrast to the national average of 12.6%. Additionally, only 17% of homeowners in Gilbert are considered "cost-burdened," a significant departure from the nationwide figure of 27.8%. With such robust incomes and a reasonable cost of living, Gilbert residents have ample funds left for investing.
#5. Arlington, Texas
If you feel your nest egg is getting wired to Uncle Sam every tax season, then we suggest a relocation to Arlington, Texas, where the state income tax rate is exactly 0%. On top of that, Arlington’s median home price of $310,195 is the lowest on our top five list, and the city boasts one of the nation’s highest year-over-year income growth rates of 17.61%, so the already wide margin between salary and housing costs should continue to grow as residents ride into their sunset years.
America’s worst places to save for retirement
Top 5 worst cities to save for retirement
#1. Los Angeles, California
The City of Angels tops our list due to some very simple math: A median yearly income of $76,135 simply cannot stand up to a median monthly housing cost of $3,239. This income-to-housing cost disparity underpins the city’s enormous number of cost-burdened homeowners (46%), and the money can’t be made up in other ways, especially with a cost of living above the national average and a sky-high state income tax rate of 13.3%. Add to this a 16.8% city-wide poverty rate, and it’s easy to see how nest eggs are going untended in Tinseltown.
#2. Anaheim, California
The most populous city in Orange County, Anaheim conjures up visions of glitzy homes and Disney resorts, but the reality for its residents is a challenging juggling act. The city’s median home price of $848,592 is chipped away at by a median household income of just $85,133, meaning residents feel the financial strain even before factoring in savings. The icy job market in Anaheim only increases the pressure – a sluggish income growth rate of just 4.14% and an unemployment rate of 4.7% put the city far off the path of national averages (7.32% and 3.5%, respectively), leaving residents thinking about their financial outlook for today, not for tomorrow.
#3. New York, New York
New York: "If you can make it there, you can make it anywhere," except perhaps to the Seychelles for retirement. With a median monthly rent totaling $2,991 and a median household income of just $74,694, a full 43.3% of city residents are classified as cost burdened. Additionally, the unemployment and poverty rates surpass the nation’s averages, with 4.5% of the city unemployed and 18.3% living below the poverty line (compared to 3.5% and 12.7%, respectively). With the third-highest income tax in the nation (10.9%), everyday New Yorkers face a steep climb toward retirement savings.
#4. Oceanside, California
Oceanside proves that the road to a rosy retirement isn’t paved with sun-kissed beaches and longboards. Despite the laid-back atmosphere, residents of Oceanside have to scramble to make their median household income of $83,271 stretch to meet the city’s median home price of $823,249. This leaves 44% of the city classified as cost-burdened homeowners. And with California’s standard 13.3% income tax, Oceanside residents can’t be blamed for skipping the monthly nest egg deposit.
#5. San Diego, California
San Diego, known as "America's Finest City," boasts beautiful beaches, a year-round mild climate, and an abundance of craft beers. However, indulging in these delights comes at a cost. With a median home price of $960,202, the highest among our top-five list, 37.8% of the city's residents find themselves classified as cost-burdened. Additionally, California’s tax rates, combined with a high cost of living index, mean that many residents will struggle to save after budgeting for housing and basic necessities.
Whether it's real estate, stocks, bonds, or mutual funds, it’s important to understand your investment options as well as your risk tolerance when it comes to investing.
Along with individual investments, another option to save for retirement is to enroll in your employer’s retirement savings plan. For many full-time workers, employer-sponsored retirement savings plans are a great perk to capitalize on. Your employer can automatically deduct from your paycheck, which can help your savings grow overtime.
Traditional Individual Retirement Accounts (IRAs) can also provide the opportunity to save for retirement with tax-deferred growth.
If you’re still unsure about your retirement planning, try using a free retirement savings calculator or speak with a financial advisor to ask about your options when it comes to saving for the future.
Methodology
To determine our ranking, we analyzed more than 170 census-defined places with a population of 150,000 or more via the U.S. Census Bureau. We compared these cities across 12 weighted variables: median household income, median monthly housing costs, percent of cost-burdened homeowners, income growth rate, poverty rate, median housing price, housing price-to-income ratio, cost of living, percent of homeowners without a mortgage, unemployment rate, state income tax rate as well as the average local tax rates in each state. Crime rate was also factored into the rankings. The Census Bureau defines monthly housing costs as the sum of payments for mortgages, deeds of trust, contracts to purchase, or similar debts on the property (including payments for the first mortgage, second mortgages, home equity loans, and other junior mortgages); real estate taxes; fire, hazard, and flood insurance on the property; utilities (electricity, gas, and water and sewer); and fuels (oil, coal, kerosene, wood, etc.).
It also includes any applicable monthly condominium fees for condominiums, mobile home costs (personal property taxes, site rent, registration fees, and license fees). Selected monthly owner costs were tabulated for all owner-occupied units for units with a mortgage.
Each variable was graded on a 100-point scale. To determine an overall score, each city’s weighted average was calculated across all metrics.
- Median Monthly Housing Costs (15 points): This metric reflects the average monthly expenses for housing in each city, which can be a significant portion of your monthly budget depending on where you live.
- Percent of Cost-Burdened Homeowners (10 points): Identifies the percentage of homeowners spending more than 30% of their income on housing costs, indicating financial strain.
- Poverty Rate (10 points): Reflects the proportion of residents living below the poverty line, impacting overall affordability and retirement savings potential.
- Median Household Income (10 points): Higher household income can provide greater financial stability and increase retirement savings potential.
- Median Housing Price (10 points): Reflects the average cost of purchasing a home in each city, influencing affordability and retirement planning.
- Housing Price-to-Income Ratio (15 points): Measures the affordability of housing relative to income, crucial for retirement planning and budgeting.
- Cost of Living (10 points): Provides an overall assessment of the affordability of daily expenses, impacting the ability to save.
- Percent of Homeowners Without a Mortgage (5 points): Indicates the proportion of homeowners who have paid off their mortgages, suggesting financial stability.
- Year-Over-Year Income Growth (5 points): Reflects the trend in income growth, which can influence retirement savings potential and overall financial well-being.
- Unemployment Rate (5 points): Low unemployment rates suggest a stable economy, which can positively impact retirees' ability to find part-time work or supplemental income if needed.
- State Income Tax Rate (2.5 points): State income tax rates directly impact retirees' disposable income and potential tax liabilities.
- Local Sales Tax Rate (2.5 points): Local sales tax rates affect the overall cost of living and savings potential.
Sources: U.S. Census Bureau’s American Community Survey, U.S. Bureau of Labor Statistics, Zillow, Tax Foundation, Internal Revenue Service, Council for Community and Economic Research, U.S. Bureau of Economic Analysis, U.S. Department of Commerce, Fidelity
Fair Use: Feel free to use this data and research with proper attribution linking to this study.
Media Inquiries: For media inquiries, contact [email protected]